UVplotter
A Python-powered web tool for Chemistry Researchers to visualize absorption spectra instantly.
🚀 Launch UVplotter App🔬 How to use UVplotter (4 Easy Steps)
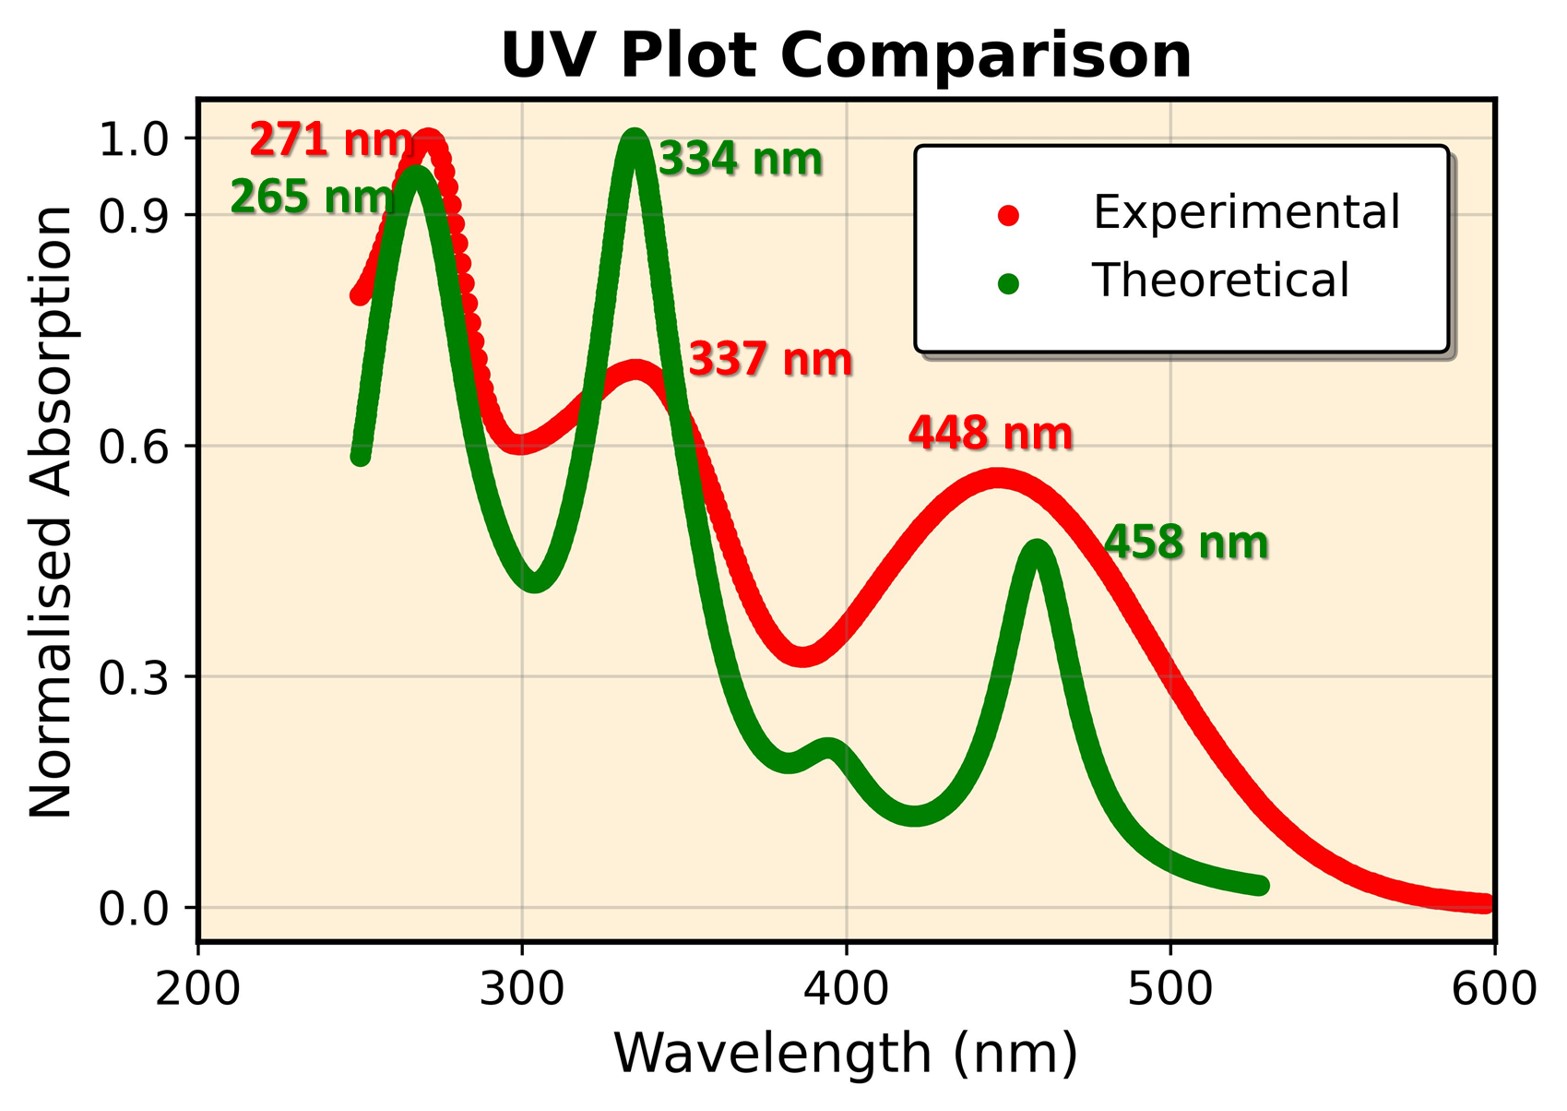
Example of a high-resolution (1200 DPI) plot generated by UVplotter
1 Prepare & Download
Click the "Download CSV/Excel" button on the home screen to see the required data format.
- Column 1: Wavelength (nm)
- Column 2: Absorption
2 Upload Your Data
In the left sidebar, select the number of complexes you want to plot (1 to 4) and upload your .csv or .xlsx file.
3 Customize Your Spectra
- Scale: Adjust wavelength and absorption ranges.
- Style: Switch between Scatter points or Polyfit Lines.
- Labels: Set your own plot titles and axis names.
- Color: Pick a background color for your graph.
4 Save & Export
Watermark: Enter the access password to remove the background text.
Export: Click "Save Plot" to get a high-resolution 1200 DPI image (JPG) ready for publication.
💡 Pro-Tip for Researchers:
If you are comparing multiple samples, check the "Normalize Data" box in the sidebar to scale all peaks to 1.0. This makes it much easier to compare spectral shapes and shifts.
If you are comparing multiple samples, check the "Normalize Data" box in the sidebar to scale all peaks to 1.0. This makes it much easier to compare spectral shapes and shifts.